Solved

Determining which clients are causing the most index growth?


Userlevel 2
Badge +9

I have a RAID-6 array of SSDs, 3.5TB in size, on my main mediaagent, that is configured as a single volume that contains both the index folder, and the DDB. For the past 4 months, we’ve seen an explosion of growth on this volume, almost doubling. My linux file server admin believes that one of our customer’s research projects is creating millions of small files, editing them over a few days, then deleting them; i.e. inode growth and free space is about the same, but of course commvault is needing to track and retain this information in each incremental backup.

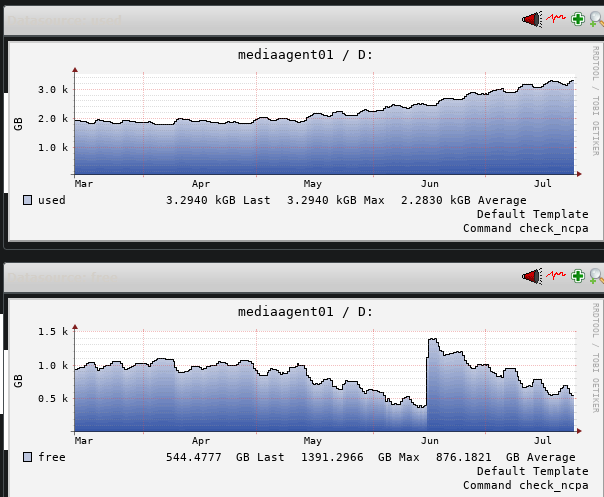
We added another SSD to the array in early June to hold off the array getting full, but as you can see, the massive growth continues.

Our backup retention strategy is 3x incremental backups every day, Sunday through Friday, and Saturday is used exclusively to create a synth full of the weekly incrementals. At the end of each month, the last saturday’s synth full is retained, and all other incrementals and synth fulls are aged out. We keep every client’s last 12 synth fulls - i.e. one year of backups with granularity of one month.

Index retention on MediaAgent01 was 15 days; I changed it down to 10 days about a week ago to see if it would make a difference. I already figured it would not though, as long as whatever file creation/editing/deletion behavior is occurring continues.

To confirm this theory, is there a report or method I can use to see which clients/subclients are causing the most growth in the Index?

icon

Best answer by Damian Andre 28 July 2022, 03:39

View original

21 replies

Userlevel 7
Badge +19

Not sure if there is a report for that purpose, have you checked the report section in software store already? One thing that could help-out here is to check the job history over a period of time and just see which clients have a high data written value which indicates that the particular clients are responsible for a high amount of new ingested data combined with the amount of files.

One thing I would like to challenge you on is the following, which is based on assumptions. You are stating that you are expecting an application/research activities of a customer to be the source. Do they stop the application/research activities so they can expect an application crash consistent recovery point? Have they ever tested it? 

Userlevel 2
Badge +9

Hi Onno - I have heard from my linux file server admin that we have a few new research projects that involve web scraping into individual JSON files. This is still assumptions on my part, but I believe they use R to analyze trends and patterns in the fields of each JSON - twitter usage analysis I know is a big one, although that one has been going on for years, not months.

So they are periodically using their R programs to ingest new loads of tens of thousands of JSON files, each one mere kilobytes in size, to then output an analysis. They’ll then delete that week’s folder of say, 20,000 files - that might not be more than 20-30MB in size, and start collecting a new folder to repeat the process.

If that pattern of usage holds true, and they’re doing this on my file server, is it reasonable to assume that commvault’s index, based on my fairly generous retention policy on my primary mediaagent, would grow like this?

My “data written” values are not that large. Like I said, I don’t think large files are being written. I think many, very small files are being written (and then deleted after a few days).

I’ll look around if there’s a report someone made that can tell me this.

(my offsite, DR-only mediaagent02 which only has a retention of one week, for example, does NOT have this same problem with running out of space on its DDB/index drive!)

Userlevel 7
Badge +23

Hey @ZachHeise,

There is an index state report that shows size of individual indexes per client.

https://documentation.commvault.com/11.24/essential/38739_health_report_index_state.html

Also available through cloud reporting (this should be the unique link for your CommCell: https://cloud.commvault.com/webconsole/reportsplus/reportViewer.jsp?reportId=IndexState&input.CommServUniqueId=96740&Table1605206417762.sort=-DatabaseSize)

There is one client in there with 260 GB of index - I am assuming that is the one you are talking about 😉

The report does not trend though, but you could export it or email it daily and build something manually.


If that pattern of usage holds true, and they’re doing this on my file server, is it reasonable to assume that commvault’s index, based on my fairly generous retention policy on my primary mediaagent, would grow like this?


edit:

So I’m a little rusty and had to talk with some folks. There are two indexing database modes, subclient and backupset. Up until 11.24 file system clients used backupset indexes, which never have their data pruned. With subclient index though, you can specify the amount of cycles to keep data in retention for the index. 

For this large client or clients where there is frequent creation and deletion of those JSON files, it would be worth converting them to subclient based indexing using this workflow:

https://documentation.commvault.com/11.24/expert/135728_using_enable_subclient_index_workflow.html

I think that page explains everything - but the key bit is this statement below - this will free up a lot of space in your scenario.

  • Over time, the system logically prunes index records of older cycles from the active index in the cache. If you browse data from older cycle(s) that have already been pruned from the index, the system will restore that index using an older checkpoint that still contains the index of those cycles.

Userlevel 6
Badge +15

There is an “Indexing Status” report available at the software store.  This report gives each client, what agents are installed and the index version for each:

https://cloud.commvault.com/webconsole/softwarestore/#!/135/663/11353

Userlevel 2
Badge +9

So I’m a little rusty and had to talk with some folks. There are two indexing database modes, subclient and backupset. Up until 11.24 file system clients used backupset indexes, which never have their data pruned. With subclient index though, you can specify the amount of cycles to keep data in retention for the index. 

For this large client or clients where there is frequent creation and deletion of those JSON files, it would be worth converting them to subclient based indexing using this workflow:

https://documentation.commvault.com/11.24/expert/135728_using_enable_subclient_index_workflow.html

I think that page explains everything - but the key bit is this statement below - this will free up a lot of space in your scenario.

  • Over time, the system logically prunes index records of older cycles from the active index in the cache. If you browse data from older cycle(s) that have already been pruned from the index, the system will restore that index using an older checkpoint that still contains the index of those cycles.

Great find on this conversion workflow! Yes, every one of the clients and subclients in question would have been created before 11.24; i’m only on 11.26 at the moment myself. During my upgrade to 11.24 the existing clients and subclients would not have been converted to use subclient indexes instead, so they’re almost certainly still using this older, less efficient index method instead?

One thing that surprises me is that the client you pointed out with a 260BGB index, bennu - that’s the linux file server we’ve been talking about, and while 260GB is quite a bit larger than every other client in there, that’s still way smaller than I thought it would be. Also, my entire index folder - (d:\indexcache) is 1.2TB - nothing else is using that folder but MA01’s index. Where is the rest of the 1TB of usage coming from, if bennu is a mere 260GB?

Is it possible that report you’re showing me is incorrect, or just not showing me the full picture? According to the most up to date report on my command center, all my clients with index values listed there are only equal to about 340GB - I’d love it if my index folder size was that small.

Userlevel 7
Badge +23

Is it possible that report you’re showing me is incorrect, or just not showing me the full picture? According to the most up to date report on my command center, all my clients with index values listed there are only equal to about 340GB - I’d love it if my index folder size was that small.


Yes - that report is only for V2 indexing I think. There could still be indexes on disk for V1 clients. Clients could be on V2 or V1 depending on when they were deployed in the V11 lifecycle. 

Might be worth getting a tool like treesize and run it over the directly to see if there are any other whales to investigate.


Userlevel 2
Badge +9

Good morning Damian - according to this report I downloaded from the store a couple days ago “Indexing Version Status” only a few clients in my environment are still using V1, and that’s because they’re things like Active Directory and MSSQL. All my file servers have been using V2 indexing since we first set up commvault, since I believe we did it in v11 SP14, and from what I have read, almost all clients since v11 was released have used V2 indexing.

I’ve definitely used Treesize before, but since it seems like the IndexCache utilizes random alphanumeric GUIDs, would it be even possible for me to figure out which GUID goes with which client/subclient?

I’ve been running the “enable subclient index” workflow on the main linux file server since 4pm yesterday. It is definitely doing something, "D:\IndexCache\CvIdxLogs\2\029D2583-7FFB-4E91-B9CB-3B84D2E708F2" is showing maybe 12-20MB/s read IO going into its files, and “D:\IndexCache\CvIdxDB\029D2583-7FFB-4E91-B9CB-3B84D2E708F2” is showing maybe 6MB/s write IO going to it. Clearly the same GUID, with reads going from “cvldxlogs” into “cvldxDB”...

Since the workflow began, loss of free space on my D drive has accelerated a little, losing another 200GB or so of the 3.5TB volume. I am hoping that what is happening here is the old client-level index is being converted into the new subclient index, but as the actual workflow job in the commserve finished last night at 9pm, and yet I’m still seeing this high IO, I’m kind of left hoping for the best! I don’t know how to see how close it is to being done with this task.

Userlevel 2
Badge +9

Okay, I’ve successfully converted all my file servers to use subclient indexes! Haven’t gained any space back on the D:\IndexCache folder yet though. Is there a command I can run to force commvault to remove the client-level indexes that are no longer in use? perhaps they’d be cleaned up ‘eventually’ but I’d like to get space back sooner rather than later - if I can!

Userlevel 2
Badge +9

Hi @Damian Andre - maybe because an answer already got marked as ‘best answer’ in this thread it’s considered ‘closed’ but unfortunately after this weekend I’m now in even more dire straights for storage on my IndexCache volume than before, after converting from client indexes to subclient. From your post above:

Up until 11.24 file system clients used backupset indexes, which never have their data pruned.

This is… kind of a big deal for me as I run out of space!

How can I delete the old client-level indexes ASAP so they stop taking up space on the volume?

Userlevel 6
Badge +13

You can run the Load Balance Report for the index: https://documentation.commvault.com/11.24/expert/100883_index_server_load_overview.html


If the media agents have overlapping data paths, you should be able to run the load balance workflow: https://documentation.commvault.com/11.24/expert/100974_running_index_server_load_balancing_with_load_balance_index_servers_workflow_indexing_version_2_commcell_console.html


I’d also recommend reviewing the space available to confirm you have the proper space available.
 

Userlevel 7
Badge +23

@ZachHeise , I asked around and the best bet now, considering your space dropping is to open a support case to get the best fix fastest.  I’d hate to suggest a few things I find and they don’t help….then you’re really in trouble.

Once you do, share the case number so I can track it.

edit: Try what @Aplynx suggests first, as he knows this better than me!

Userlevel 2
Badge +9

Hi @Aplynx I don’t think that can apply to us because our two mediaagents are purposely separated - completely different data paths since MA01 is onsite and for primary recoveries, MA02 is offsite and only for DR. That ‘load balance workflow’ you mention is already running automatically every week as part of the commvault-created default schedule, but since no data paths are shared between the two media agents, and I don’t have any other on-prem index servers, it probably isn’t doing anything (i.e. each job in the history finishes after 5 seconds).

I downloaded the workflow you mentioned and ran it, and it points out (accurately) that within the index, 750GB is consumed by ‘index size’ and 570GB is consumed by ‘logs size’ which matches what Treesize on "D:\IndexCache\CvIdxDB" and "D:\IndexCache\CvIdxLogs" says, respectively.

The number of files on this file server has more than doubled since May, and the total size of the backup (based on looking at the weekly synthetic fulls) has almost doubled. I knew when we added these new projects to the file server, that we’d see some index growth, but the amount of disk space its using has now tripled, which was very surprising.

I’d also recommend reviewing the space available to confirm you have the proper space available.

Right - if it turns out that doubling the size of this file server has resulted, accurately, in the index needing to triple in size (which is what it has done) in order for commvault to function, then so be it, i’ll need to add more SSDs.

I am still holding out hope though, that it is still possible for me to reclaim space by removing the now-unneeded backupsetindexes and I won’t need to buy new SSDs.

I’ve created ticket 220801-662 @Mike Struening 

Userlevel 7
Badge +23

Noted, thanks!

Userlevel 2
Badge +9

Got off the phone with commvault support earlier today, he directed my attention to this article: https://documentation.commvault.com/11.26/expert/144770_modifying_index_pruning_settings_for_subclient_level_indexes.html

I was really hoping to only save a couple days worth of index results for this linux subclient and therefore selected the “retain index in cache for # of days” - and only picked 2 days.

I was very surprised and disappointed to see the line “(note that a minimum of 2 cycles will be retained, no matter what number you enter in this field).” for that option. That completely defeats the purpose for me if choosing the day option is going to force this subclient to hold onto 2 cycles worth (about 2 months in our case) worth of index data.

In the end, I selected the “Retain index in cache for [Number] cycles.” and just put in 1 cycle. It’s still way longer than I want this cache to be around. But hopefully it will slow the bleeding.

I’d love to see, in a future version, the ability to really use that option to only save index cache for [Number] of days.

Userlevel 7
Badge +23

@ZachHeise , can you ask the case owner to request a CMR for that feature?  It might not be feasible since a cycle ensures the you can at least restore the full and its Incs.

Userlevel 2
Badge +9

“ I checked internally and Development added that by default to prevent data loss, that is no to the CMR “

long shot, no luck.

I get that commvault shouldn’t have this as an easily accessible option to protect junior admins from shooting themselves in the foot, but it’s disappointing that there’s no way to take off the training wheels here.

Userlevel 7
Badge +23

Fair enough, @ZachHeise !

Userlevel 2
Badge +9

Hi again folks - so using some scripting to search for new OR changed files on the linux file server every 6 hours, corresponding with our commvault backup schedule, we’ve found a user who is creating 85,000 files every day, JSONs as expected.

Is there any way to interpret this quantity of file creation/modification/deletion as to how it would affect the commvault index? How much should the index folder on a mediaagent grow per modified file record on a client?

On my side, it looks like we’ve got 150-200GB less on the Index drive every week vs the previous week.

Userlevel 7
Badge +23

I believe it’s based on number of files, not just size, though I’ll defer to @Aplynx and @Damian Andre .

Userlevel 2
Badge +9

Right, that’s what I figured - part of that same automated scraping script that user is doing is also generating 10 400MB stata files every night too. But I don’t care about 10 files being made and neither does the index - right?

I’m much more concerned about the 84,990 files that are 10-300KB in size being generated at the same time, and I was just wondering if that number of files, created every day (and then deleted the next day) would be a reasonable thing to point at and say “ah-hah, that’s why our index is growing so quickly and exponentially”

Thanks, Mike!

Userlevel 7
Badge +16

We had a similar issue, indeed if an incremental backup introduces large number of files on a frequent base the index will grow significantly. Your 84,990 files could definitely be a reason for consuming so much index space


Regarding: "In the end, I selected the “Retain index in cache for [Number] cycles.” and just put in 1 cycle. It’s still way longer than I want this cache to be around. But hopefully it will slow the bleeding."

I assume you make synthetic fulls? Can you shorten the cycle length / schedule frequency for this specific situation? From a synthetic full per month to per 2 weeks or a week for that matter? Shorter cycle = shorter retention period. 

Reply