Question

SQL restore taking to long

  • 30 January 2023
  • 7 replies
  • 359 views

Userlevel 1
Badge +12

Hello,


I have some issue with restoring sql DB to another VM, the issue is that it take to long sometimes almost 1 day for 2.9TB. The sql back used 4 stream and using 5 streams for restore. Hier are some logs for the restore which still running


Any idee why its taking so long? 


7 replies

Userlevel 6
Badge +15

Good afternoon.   While it is hard to get the full picture from the limited log cuts provided, one thing that stands out are the very slow media read speeds.   This is the speed which the data is able to be read from the source disk:

546441 2f2727 01/30 16:26:46 2609252 [FSRESTHEAD ] 914-# Stats: [MediaRead Speed] Curr Avg [2.52] MB/Sec, Bytes [1582861573]; Total Avg [2.57] MB/Sec, Bytes [32932778837]
546441 2f26f4 01/30 16:34:46 2609252 [FSRESTHEAD ] 913-# Stats: [MediaRead Speed] Curr Avg [2.60] MB/Sec, Bytes [1636006602]; Total Avg [2.57] MB/Sec, Bytes [34276930210]
546441 2f2727 01/30 16:37:05 2609252 [FSRESTHEAD ] 914-# Stats: [MediaRead Speed] Curr Avg [2.58] MB/Sec, Bytes [1675570472]; Total Avg [2.57] MB/Sec, Bytes [34608349309]
546441 2f26f4 01/30 16:45:05 2609252 [FSRESTHEAD ] 913-# Stats: [MediaRead Speed] Curr Avg [2.52] MB/Sec, Bytes [1634358247]; Total Avg [2.57] MB/Sec, Bytes [35911288457]


Can you please run the disk performance tool against the source disk and provide the results:

https://documentation.commvault.com/2022e/expert/8855_disk_performance_tool_01.html

Userlevel 1
Badge +12

@Orazan Do i need to run on destination client disk or on which one ? 

Userlevel 1
Badge +12

@Orazan Here is the output of disk perf:


Creating Report CvDiskPerf.txt ... Could not Delete :[d:\database\DISK_READ_TEST]. ErrorCode :[-2147024893]

 Creating folder d:\database\DISK_READ_TEST
 Creating files..
 Writing files..
 Reading files..
 Deleting files..
DiskPerf Version        : 2.2
Path Used               : d:\database
Performance type        : Create new
Read-Write type         : RANDOM
Block Size              : 65536
Block Count             : 16384
File Count              : 6
Thread Count            : 6
Total Bytes Read        : 6442450944
Total Bytes Written     : 6442450944
Total Bytes Deleted     : 6442450944
----
Time Taken to Create(S)     : 11.08
Time Taken to Write&flush(S): 7.56
Time Taken to Read(S)       : 12.08
Time Taken to Delete(S)     : 0.10
----
Per thread Throughput Create(GB/H)     : 324.87
Per thread Throughput Write(GB/H)      : 476.08
Per thread Throughput Read(GB/H)       : 297.98
Per thread Throughput Delete(GB/H)     : 35672.49


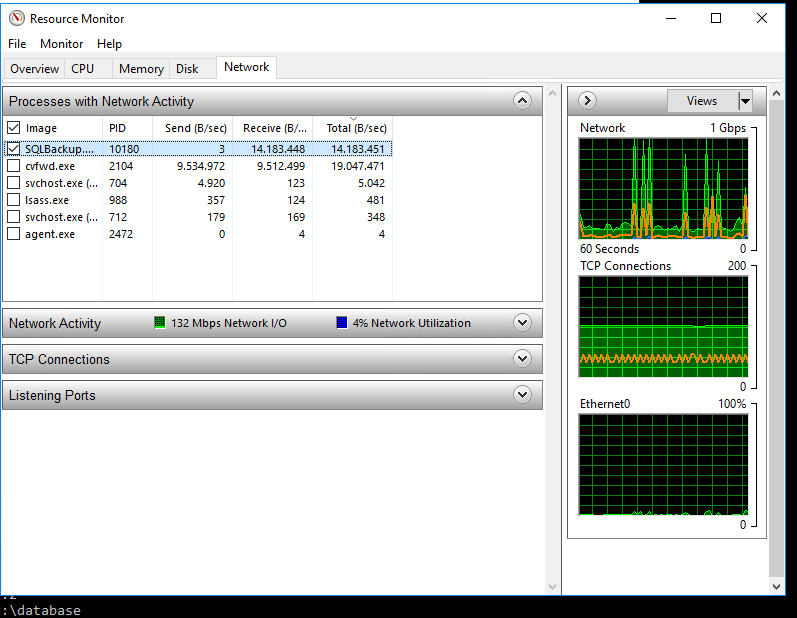
And now is the restore job running and when i take a look to network perf, that is kind low i guess,


And on MA:


789536 c3d46  01/31 11:19:22 ####### 2612597-3-DataMover-GetLink: Avg Time [29.02 us/op, 59.37 us/op], Avg Rate [34454.12 op/s, 16842.97 op/s], Time [107.65 ms, 6.16 s], Samples [3709, 103694]
789536 c3d46  01/31 11:19:22 ####### 2612597-3-DataMover-SyncReadAhead: Avg Time [25.94 us/op, 75.34 us/op], Avg Rate [38543.39 op/s, 13273.97 op/s], Time [113.20 ms, 9.11 s], Samples [4363, 120951]
789536 c3d46  01/31 11:19:22 ####### 2612597-3-DataMover-LookAhead-MdOpen: Avg Time [29.00 us/op, 27.59 us/op], Avg Rate [34482.76 op/s, 36248.30 op/s], Time [29.00 us, 220.70 us], Samples [1, 8]
789536 c3d46  01/31 11:19:22 ####### 2612597-3-DataMover-LookAhead-Free Slot Wait: Avg Time [213.74 ns/op, 220.40 ns/op], Avg Rate [4678610.21 op/s, 4537269.41 op/s], Time [921.00 us, 26.58 ms], Samples [4309, 120592]
789536 c3d46  01/31 11:19:22 ####### 2612597-3-DataMover-LookAhead-Batch Wait: Avg Time [96.96 ms/op, 106.14 ms/op], Avg Rate [10.31 op/s, 9.42 op/s], Time [250.84 s, 8234.70 s], Samples [2587, 77581]
789536 c3d46  01/31 11:19:22 ####### 2612597-3-DataMover-LookAhead-DMCmd Wait: Avg Time [36.90 s/op, 13.39 s/op], Avg Rate [0.03 op/s, 0.07 op/s], Time [36.90 s, 107.13 s], Samples [1, 8]
789536 c3d46  01/31 11:19:22 ####### 2612597-3-DataMover-LookAhead-Get Link: Avg Time [688.86 ns/op, 10.80 us/op], Avg Rate [1451667.00 op/s, 92566.16 op/s], Time [2.98 ms, 1.31 s], Samples [4328, 121164]
789536 c3d46  01/31 11:19:22 ####### 2612597-3-DataMover-LookAhead-Loop: Avg Time [1025.00 s/op, 1190.93 s/op], Avg Rate [0.00 op/s, 0.00 op/s], Time [1025.00 s, 8336.52 s], Samples [1, 7]
789536 c3d46  01/31 11:19:22 ####### 2612597-3-DataMover-LookAhead-Batch Loop: Avg Time [13.73 ms/op, 8.52 ms/op], Avg Rate [72.81 op/s, 117.31 op/s], Time [933.94 ms, 16.16 s], Samples [68, 1896]
789536 c3d46  01/31 11:19:22 ####### 2612597-3-DataMover-LookAhead-Offset Wait: Avg Time [8443.66 s/op, 4479.46 s/op], Avg Rate [0.00 op/s, 0.00 op/s], Time [8443.66 s, 35835.65 s], Samples [1, 8]
789536 c3d46  01/31 11:19:22 ####### 2612597-3-DataMover-LookAhead-RawIO: Bytes [1.13 GB, 30.89 GB], IO Rate [1.89 MB/s, 1.87 MB/s] IO Size [127.86 KB, 127.87 KB]. Avg Time [66.07 ms/op, 66.88 ms/op], Avg Rate [15.14 op/s, 14.95 op/s], Time [613.49 s, 16938.67 s], Samples [9286, 253266]
789536 c3d46  01/31 11:19:22 ####### 2612597-3-DataMover-LookAhead-LinkReader-MPId 322-MdRead: Bytes [1.25 MB, 35.13 MB], IO Rate [796.19 MB/s, 27.67 MB/s] IO Size [151.00 B, 151.00 B]. Avg Time [182.05 ns/op, 5.24 us/op], Avg Rate [5493145.47 op/s, 190853.25 op/s], Time [1.58 ms, 1.27 s], Samples [8655, 242319]
789536 c3d46  01/31 11:19:22 ####### 2612597-3-DataMover-LookAhead-LinkReader-MPId 322-MdSeek: Avg Time [100.00 ns/op, 100.00 ns/op], Avg Rate [10000000.00 op/s, 10000000.00 op/s], Time [100.00 ns, 600.00 ns], Samples [1, 6]
 

Userlevel 6
Badge +15

On the MediaAgent processing the job, you will see a log called CvPerfMgr.log.  If you open that in GXtail, and hit F5, do you can filter for the ID of the backup.   Do you see that job in that log?

Userlevel 1
Badge +12

@Orazan i am looking at MA performed the restore and i couldn't find the job there. 

Userlevel 6
Badge +14

Hello @Egor Skepko 

There is certainly no limitation on the SQL side write speeds are fast does still appear to be MA related

2084  2240  01/30 17:47:29 2609252 stat- ID [SQL Data Write Timer], Bytes [92861616128], Time [81.261571] Sec(s), Average Speed [1089.810809] MB/Sec


On the disk perf test you performed its showing “  Creating folder d:\database\DISK_READ_TEST “

Is that the same location as where the data is being pulled on the restore? The logs are showing:

/disklibrary/0702/U4FG3A_Folder1/CV_MAGNETIC

/disklibrary/071d/Q42X9S_03.25.2022_13.54/CV_MAGNETIC

/disklibrary/0710/ZYK8EU_Folder1/CV_MAGNETIC


That tool should be ran on the MA(s)

sv1759

sv1757

Userlevel 1
Badge +12

@Scott Reynolds Here is the output of the test, how do i test with the singel DB of 2 TB ?

 ./CVDiskPerf -PATH /disklibrary/071d -BLOCKSIZE 65536 -THREADCOUNT 1 -FILECOUNT 1
Creating Report CvDiskPerf.txt ...
 Creating folder /disklibrary/071d/DISK_READ_TEST
 Creating files..
 Writing files..
 Reading files..
 Deleting files..
DiskPerf Version        : 2.2
Path Used               : /disklibrary/071d
Performance type        : Create new
Read-Write type         : RANDOM
Block Size              : 65536
Block Count             : 16384
File Count              : 1
Thread Count            : 1
Total Bytes Read        : 1073741824
Total Bytes Written     : 1073741824
Total Bytes Deleted     : 1073741824
----
Time Taken to Create(S)     : 2.00
Time Taken to Write&flush(S): 1.00
Time Taken to Read(S)       : 1.90
Time Taken to Delete(S)     : 0.10
----
Throughput Create(GB/H)     : 1797.85
Throughput Write(GB/H)      : 3596.22
Throughput Read(GB/H)       : 1892.46
Throughput Delete(GB/H)     : 35937.83

Reply