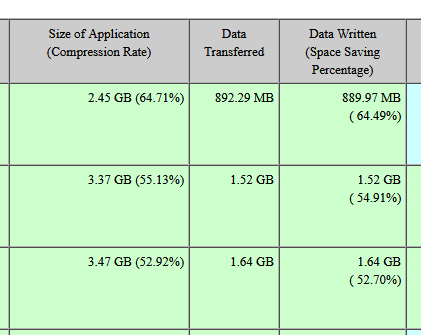
How do I read this job status data? What is my deduplication savings if any, or is it just compression alone. Where do I look for actual deduplication savings for the job.

Can I leave deduplication enabled for transaction logs, or will that affect performance?
Once job is completed I only see this :

Could it be that

my dedupe savings is nil? Or am I am mixing the terms and compression is actually a deduplication?


Job Summary Report would be a good place to start: https://documentation.commvault.com/11.24/expert/39614_backup_job_summary_report.html

There are multiple options, and you can run it for a single job id or client or groups, etc.


I do not see what i need regarding dedupe:


Hi @Vitas,

In general, transaction logs are always excluded from deduplication regardless of the storage policy settings. You can confirm that in the documentation here for your specific agent.

e.g for oracle:

You can assign a deduplicated storage policy for log backups. However, the Oracle agent considers the storage policy as a non-deduplicated storage policy and does not deduplicate the logs.


This is because transaction logs are mostly unique and tend to deduplicate very poorly. So what you see in the report should be related to compression only. The final data written include indexing and metadata which is why the value is slightly different from data transferred.


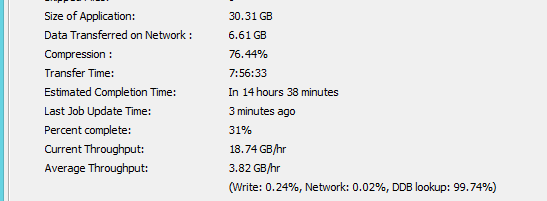
Well, then we have some type of a mismatch, if what you say it is true and Commvault is smart enough not to deduplicate, why my job is spending 99% of time trying to deduplicate(DDB lookup). Something is off.

And do you have a place to look up actual deduplication factor? Previous suggestion did not work for me.

I agree that something looks off on the DDB lookup % - it should not be engaging deduplication for a log backup. However, the size of this log backup seems larger than your other example, are we sure its only a log backup? In your other reports they are of more expected size (< 10GB)

To calculate compression vs deduplication savings (remembering that deduplication occurs after compression) - here is what I remember:

In the report that you ran, it shows you the compression % next to size of app. The size of application itself is without compression applied, so you manually have to calculate size after compression it using the % provided.

So on the first job of your report example 2.45 GB was the raw size of the logs. It compressed at a rate of 64.71% - which will bring the size after compression to 864 MB. When deduplication is enabled, size on disk would be after compression and deduplication. So in that first instance, even if dedupe is enabled you are getting nil savings in that example.

In either case, to investigate why DDB lookups are happening on log backups, I think we would need a case to check out the logs and figure out what is going on there.


You are right, looking at big full job, deduplication savings is more visible, but still, compression gives more space saving than deduplication. Given my dismal DDB performance, I have to bypass deduplication.


You are right, looking at big full job, deduplication savings is more visible, but still, compression gives more space saving than deduplication. Given my dismal DDB performance, I have to bypass deduplication.


With a healthy DDB it should not be having such an impact - Might be worth seeing if we can improve the performance there. First suggestion (if not already done) is to upgrade the DDB to V5  this generally brings performance improvements beyond the basics of improving the underlying disk etc.