
Hi Team,


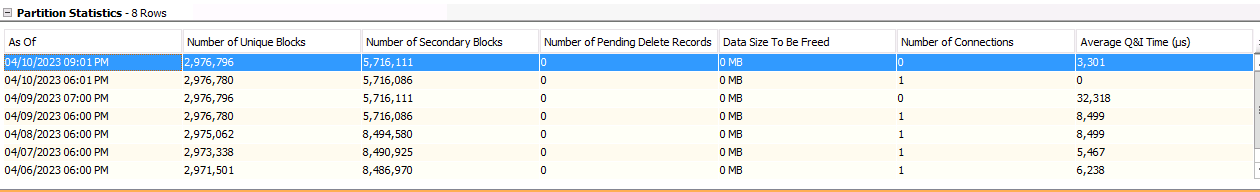
I’m experiencing High Q & I time for partitions and could see that SIDB engine is mapped to 1 storage policy(Only Primary copy we have) which is writing 2 backups daily(1 FS and 1 VM).


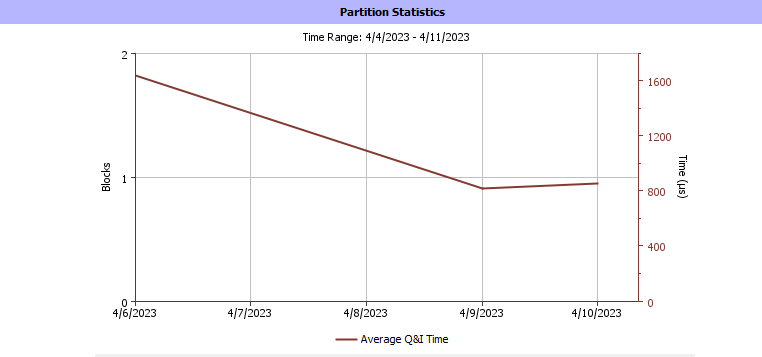
Bue the Q & I time is fluctuating between 300 % to 400 %. Please let me know what could be the issue.


Note: No Pending delete records.


Regards,

Harshavardhan.

Hi @naraharsha ,

Can you check this post:


Best Regards,

Sebastien


@Sebastien Merluzzi Thankyou for this Article. We observed there’re good IOPS and DDB’s are hosted on SSD’s only. But still the Q & I gradually increasing.


And one more query is I’m not able to get the hourly Q & I data here, but for other DDB engines i could see hourly data in the statictics.


@naraharsha ,

This looks random, never seen this before.

But the best is to display Q&I in the graph:


Is AV scanning the DDB drives, what else do you have on the DDB drive?


@Hyder No AV on the DDB Drives.

The same DDB MA’s are being used as DDB partitions in other SIDB Engines(Here Q & I is 10 to 15% only.)


Hi @naraharsha ,

I would recommend you log a case with Support so we can review.

Best Regards,

Sebastien


Check with your storage team too, maybe there’s a problem with the array/raid on that DDB, also you could move the DDB to another drive to isolate if the current drive is an issue
 

Feels like a HW issue


@Hyder and Team, 


will the DDB Reconstruction helps to reduce the High Q & I time????


Reply