After upgrade to 11.28 - Command Center is showing inaccurate Information
Noob alert!
Hi everyone, I hope you`re all doing well !
We upgraded from 11.25 to 11.28 and since the Upgrade, the Command Center(Web-Admin) is showing inaccurate information. Here You have some examples:
Also searching Users or Laptops over any “search-box” is not working and more.
Does anyone has an idea, what this issue could be? Any suggestions or thoughts please?
» Extra Info: Health Report Show this as “Critical” thou I do not know if I should trust it.
Thanks in advance for your time and help!
Page 1 / 1
Hello Cronos,
on the command center, go to the reports section and open any report. check if it shows any data or it fails with any error.
it appears that there may be some issue with the Reporting Engine. check for any errors. in adminconsole.log and CustomReportsEngine.log.
Please get in touch with the support to check for any connection errors.
Thanks
Venkat
Hi @Cronos
Also, Is MongoDB service running?
Thanks,
Venkat
Hello Cronos,
on the command center, go to the reports section and open any report. check if it shows any data or it fails with any error.
it appears that there may be some issue with the Reporting Engine. check for any errors. in adminconsole.log and CustomReportsEngine.log.
Please get in touch with the support to check for any connection errors.
Thanks
Venkat
Hi Jupalli,
As suggested I went to the “report section” and opened “Reports\Administration\User and user group permissions”. I saw a few issues, see the attached file “Reports-errors.txt”.
Than I re-did the same steps and now I do not see any issues, see the attached file “Reports-OK.txt”.
I manually selected all the groups and the results are good, the browser and search-box works. The information show under “Reports” here is accurate.
Later while browsing some issue-log reappeared for a short moment as in “Reports-errors.txt”. In general the Report Section is working good.
In the other hand the search-box and view(results) in other places are not working. For example, in “Manage\Security\Users”, I went inside an made a search and the logs are like if nothing happened.
AdminConsole.log : 7960 6 10/19 12:58:35 cv65Qkf1KH 172.XYZ.XYZ.XYZ INFO AuditLogger:auditLog:992 - Commvault (Admin) 0 200 UI /nav/network 7960 6 10/19 12:58:35 cv65Qkf1KH 172.XYZ.XYZ.XYZ INFO AuditLogger:auditLog:992 - Commvault (Admin) 0 200 UI /nav/musers 7960 6 10/19 12:58:35 cv65Qkf1KH 172.XYZ.XYZ.XYZ INFO AuditLogger:auditLog:992 - Commvault (Admin) 0 200 UI /users 7960 14 10/19 12:58:40 cvJLux0RFw 172.XYZ.XYZ.XYZ INFO ServerBroker:logServerResponse:626 - Thread:24355 Status Code: 200 Server Response: Response received (size=106229) 7960 18 10/19 12:58:57 cvg6SliHOS 172.XYZ.XYZ.XYZ INFO ServerBroker:logServerResponse:626 - Thread:28249 Status Code: 200 Server Response: Response received (size=106229)
CustomReportsEngine.log: Didn’t show anything.
Is there anything else I could check or do?
Thanks for the time and Help.
Hi @Cronos
Also, Is MongoDB service running?
Thanks,
Venkat
Everything is running:
Is there anything else I could check or do?
Thanks for the time and Help.
Hi Everyone, I created a ticket and it got solved. In Resume: an extra firewall rule was needed or missing on the server.
The webserver.log was reviewed and the following was noticed:
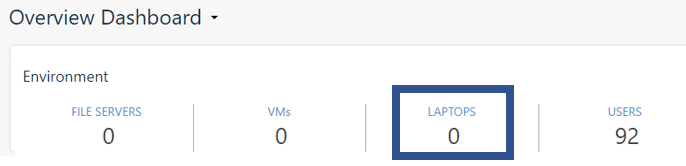
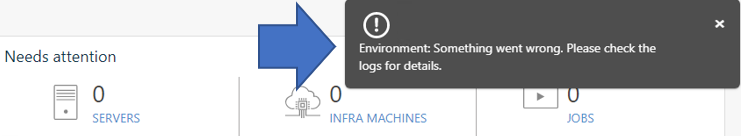
Re-Checking the main page in the incognito window and we still had the same issue.
The CVentitycache.log was reviewed and the following was noticed:
---> System.TimeoutException: A timeout occured after 30000ms selecting a server using CompositeServerSelector{ Selectors = MongoDB.Driver.MongoClient+AreSessionsSupportedServerSelector, LatencyLimitingServerSelector{ AllowedLatencyRange = 00:00:00.0150000 } }. Client view of cluster state is { ClusterId : "1", ConnectionMode : "Automatic", Type : "Unknown", State : "Disconnected", Servers : r{ ServerId: "{ ClusterId : 1, EndPoint : "Unspecified/commvault.dymo.uk:27017" }", EndPoint: "Unspecified/commvault.dymo.uk:27017", State: "Disconnected", Type: "Unknown", HeartbeatException: "MongoDB.Driver.MongoConnectionException: An exception occurred while opening a connection to the server. ---> System.Net.Sockets.SocketException (10060): A connection attempt failed because the connected party did not properly respond after a period of time, or established connection failed because connected host has failed to respond.
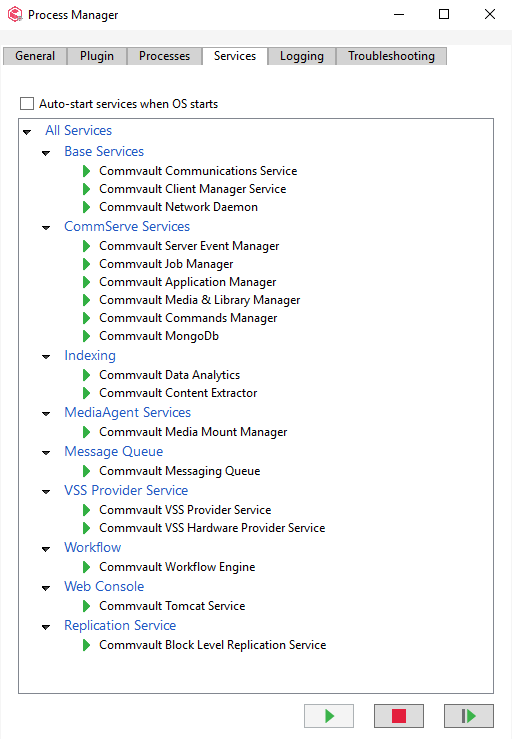
The port 27017 was opened in the Server`s firewall, Tomcat was restarted and it worked. I made some tests and as long as the port is disable in the FW, the issues re-appears. I did enable it again without restarting Tomcat and its working again.
Thanks for the support!
We've experienced similar issues in the past in where we had to add/fix connectivity between Commvault components in the past. I truly hope this is addressed in the future by making more use of tunneling and also to included tests for these additional ports in check readiness.
Indeed, have two customer who recently experience the same kind of problems.
From inconsistent storage reports, dashboard issues, issues with overviewing protected VM's and searching.
Sometimes a restart of the Mongodb helps or suddenly the connection is based on short names of the server and had it to add to the host file of the webserver and FQDN works but not for the process..