Solved

Grafana in Commvault


Michael De Piccoli
Bit
Forum|alt.badge.img

Good Morning at all,


someone know something about Grafana and if it is possible to connect this add-in to the Commvault infrastructure?


Thanks

Best answer by Damian Andre

Hey @Grafana in Commvault,

I have done this before, but relied on some direct SQL queries on the CommServe to get the data I needed. I found that I was mostly monitoring the system rather than the software (i.e disk space on mount paths, CPU usage, network bandwidth etc). But I did do basic Job running / suspended / pending etc by querying certain tables. 

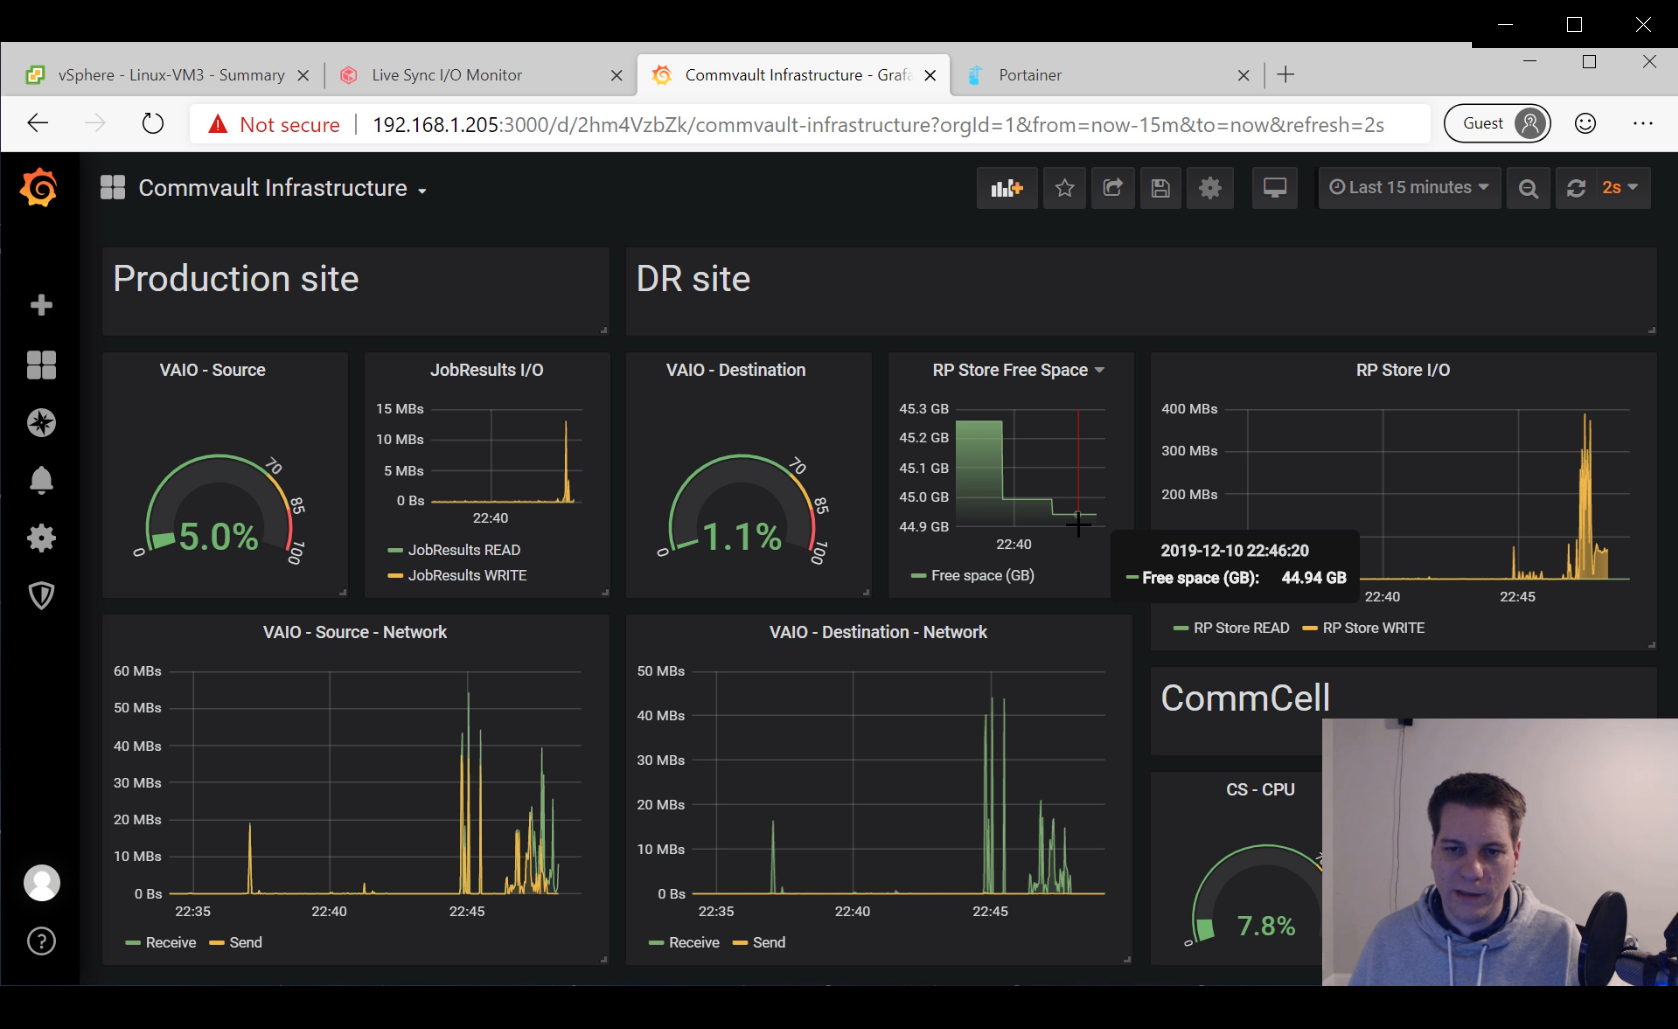
Here is a snap for an internal video I used grafana to showcase how Live Sync I/O worked - but most of this data was from the system rather than pulling from Commvault. Its certainly possible but like you would integrate any other system for monitoring, you need to know your way around the API or SQL tables to find what you are looking for - there is no Grafana pre-created plugin for Commvault.
 

View original
Did this answer your question?

3 replies

Damian Andre
Vaulter
Forum|alt.badge.img+23
  • Vaulter
  • 1229 replies
  • Answer
  • June 24, 2021

Hey @Grafana in Commvault,

I have done this before, but relied on some direct SQL queries on the CommServe to get the data I needed. I found that I was mostly monitoring the system rather than the software (i.e disk space on mount paths, CPU usage, network bandwidth etc). But I did do basic Job running / suspended / pending etc by querying certain tables. 

Here is a snap for an internal video I used grafana to showcase how Live Sync I/O worked - but most of this data was from the system rather than pulling from Commvault. Its certainly possible but like you would integrate any other system for monitoring, you need to know your way around the API or SQL tables to find what you are looking for - there is no Grafana pre-created plugin for Commvault.


Mike Struening
Vaulter
Forum|alt.badge.img+23

Hey @Grafana in Commvault , following up to see if you had any questions after @Damian Andre ‘s reply….

also, I assume you want to change your name, so shoot me a private message with what you want me to change it to and I’ll get that done :hugging:


Forum|alt.badge.img

Hi @Damian Andre ,

i am new at this commvault ↔ influx ↔ grafana stuff. I am trying to get detailed library-capacity-data from the API. But the output of our libraries have 1 lil problem in common. I got the capacity-results as a string with the Unit, e.g “100 GB”. But influx need metrics instead of strings. But getting only the number out of the string removes the scale and its impossible to compare total-capacity against free-capacity if the unit is different (e.g. total-capacity: 10 TB and free-space: 250 GB)

my purpose behind is to establish a monitoring of “how many freespace is left” and raise a notification. If we reach 75% raise a warning or at 90% a critical. So i need a way to normalize these capacity-values. And i can see in your screenshot a graph of free space.

is there a way to tell the api to give me all capacity-values in the same unit, e.g Megabyte or Gigabyte?

Regards Mathias


Cookie policy

We use cookies to enhance and personalize your experience. If you accept you agree to our full cookie policy. Learn more about our cookies.

 
Cookie settings