Hi !

I’m used to old-style storage/schedule policies and clients/subclients associations..

But we’re told that PLANS are the future, and we’ll have to move to Plans for sure.

So I’ve deployed a few new MAs to protect some locations inside my company, where I have to protect VSA + file level backups.

I have local disk backup, then auxcopy to tape and auxcopy to cloud from primary.

MA is physical linux, as we have windows VSA clients, I have also deployed Windows VSA Proxy.


Then I created Storage pools for local disk, tape copies and Cloud copies.

To simplify things and test Plans, I created a Plan per location, with standard details, like 1 day RPO, 1 month of retention, with my backup timeslots, full timeslots (confusing with synthfull out of control, but we’ll discuss that later in this thread I guess).

I created a VSA VM group that points to my VMWare location ( = selects all the VMs in that location, including my VSA proxy VM).

For some VMs, I was asked to also provide file-level backup of some key folders more often than the daily backup, so for this I later derived from this plan, keeping all setting but changing RPO to like 1 hour and retention to 2 days.

To make sure I would not get a non protected VM in the hypervisors overview, that’s how I did.

But the problem is that all backup jobs start at the same time, and the VSA Proxy VM itself is beeing backup while it is backing-up all the other VMs, causing warnings, or even potential issues.


I would like to know how you would do (or have done) in such case, as my target is to simplify/ease/automate as much as possible, reduce amount of formerly called StoragePolicies, and make sure any new VM created in a location is automatically included in the Plan.


I would find helpful to be able to provide some kind of priority in Plans, or override timing options in clients and subclients associated to a plan, instead of having to Derive from a plan just to provide other backup timeslots.


And while I’m writing about timeslots in plan, well, I find it a bit hard not to be able to manually input backup timeslots in Plans (clicks are sometimes approximative, I’m not good at mouse drawing..) and also select more precise times other that ‘oclock’ times, like 1:15AM or 23:35. Today so far it’s only 1:00AM or 23:00 or midnight. But nothing inbetween.


Mike or any moderator, don’t hesitate to move this conversation to what should be its more accurate location here 🙂

Hi @Laurent 


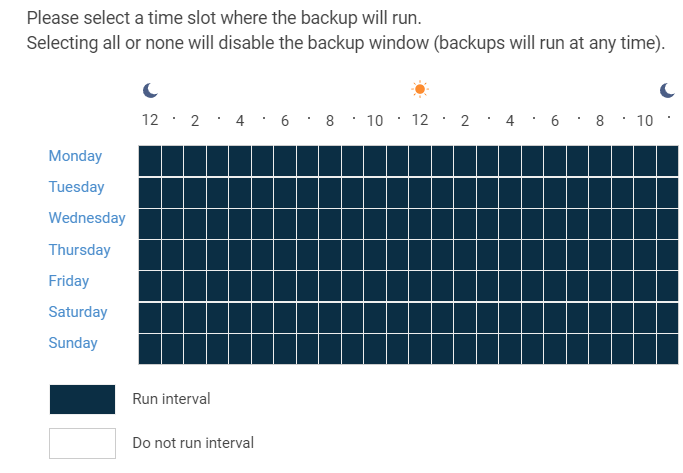
Thank you for reaching out. Unfortunately, run times can only be configured on an hourly basis per the screenshot below:


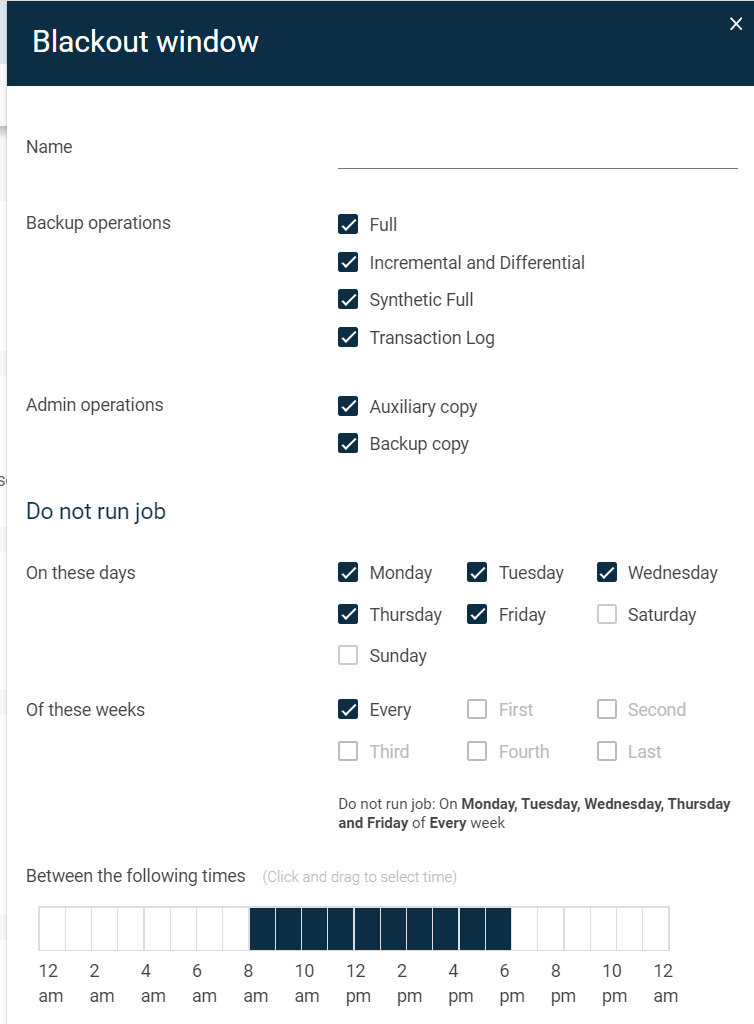
In order to stagger some backups, you could most likely utilize Client Groups (or Server Groups in Command Center) and configure blackout windows. This way, you can at least stagger backups for groups of servers by telling them not to run at specific times. For example:


This would prevent jobs from running for any server in this Server Group from 8am - 6pm and the group would run backups per the plans settings outside of the blackout window. 


As for the issue with not being able to drill down to a more specific time, I don’t believe we have any options to modify the time from hourly to a more specific time (such as 8:15 instead of 8:00). This may possibly require a Customer Modification Request (CMR) to see if development can implement anything for manual fine-tuning.


Hope this helps!


Hi @Chuck Graves 

Thanks for the suggestion, I never thought about that (that’s one of the reasons I enjoy this Community).

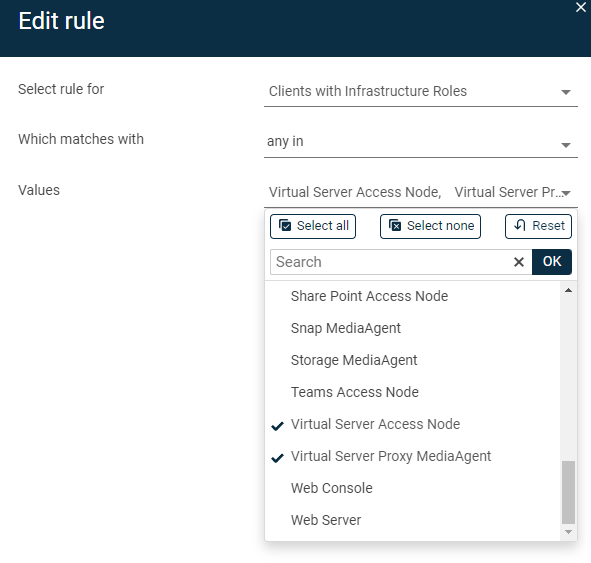
I’ve created a dynamic group to target all the clients that have VSA MediaAgent or VSA Proxy role :


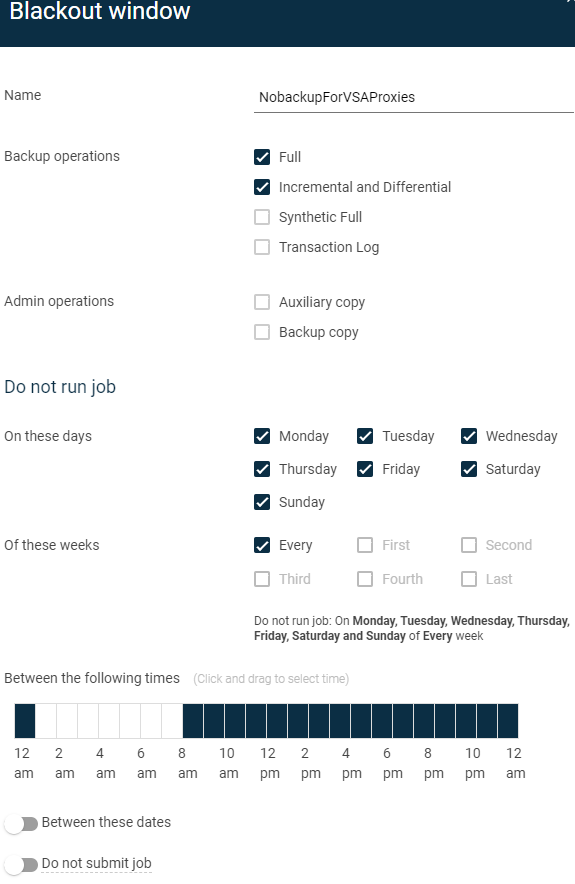
...and created a blackout to have no backup between 8AM-1AM, leaving the 1AM-8AM for backups of my proxies, like this : 


I hope that this does not disable the backup ability of my Media Agents, meaning they would not perform VSA backup until now 1AM.. 😱

I hope it really targets the single client where I have the MediaAgent role, and not the full MediaAgent role.

I’ll update you tomorrow. 😉


Hi !

Today’s update : it’s a mess in my job queue this morning.. 🤣

  1. The group that I created extended to the physical MAs that have DDB backup scheduled every 4 hours. So they’re on blackout during that time, then I have no DDB backup for each.
  2. The blackout period itself from the Command center does not show if the blackout is applied to the local time of the MA or not. From what I remember of the Blackout windows through Java console, there’s a mention about it.

So, I have changed my blackout timeslot to have them running properly, first, but I need to find how to (automatically) identify/select the VSAProxy VM, but not the MediaAgents that have DDB.. 

Where can I find the list of variables that I can select as “rule for” / “values” ?


Hello @Laurent

Sorry to hear about the issue! Do you know if the Media Agents with the DDBs are also VSA Proxies as well? I believe the only way around this would be manually assigning the Media Agents without a DDB to that group. 


I tried checking in my very limited lab environment but you can work with the rules on the server group and once you hit “preview”, it should populate with the list of servers. If the list contains the MA’s that have DDB’s on them and should not be included, you can modify the rule further or even add another rule to exclude them. Maybe something like adding a rule for excluding MA’s with File System Agent Installed since the DDB’s are protected using the File System agent?


Chuck


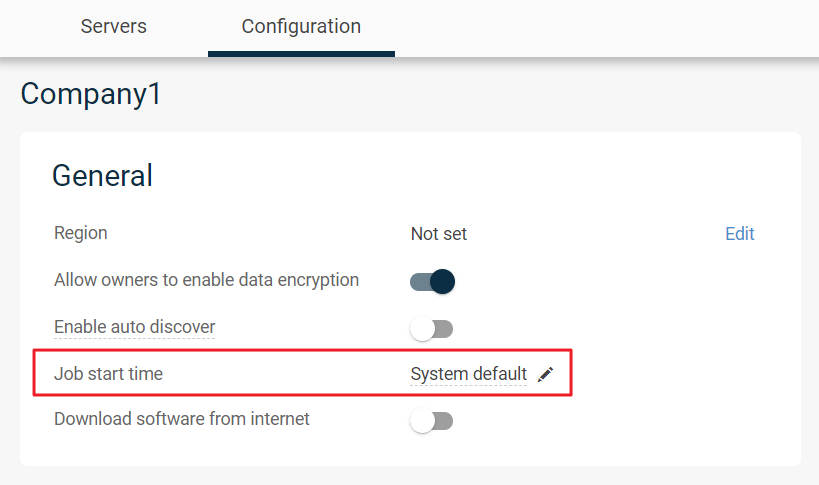
How about setting the Job Start Time on the Server Groups?


Thanks,
Scott


Hi @Chuck Graves and @Scott Moseman 

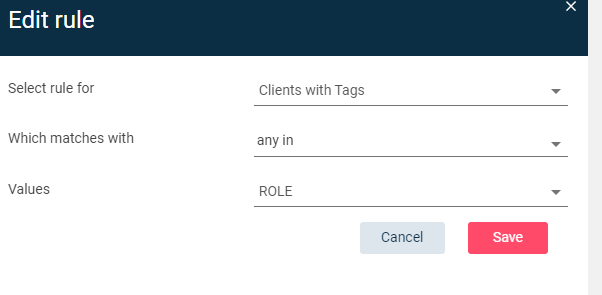
Chuck, I guess that I should add a ‘VSAProxy’ tag to each proxy VM, and setup my group to include ‘Clients with Tags’ any in VSAProxy. I would have liked to find a rule that would be like ‘client is a VM’ but did not find such. 

As my MAs are physical, and my VSA Proxies are virtual, it would be an easy way to identify them this way.


Scott, I saw that ‘Job start time’ listed, but I could not find how to edit it until I retried today, clicking on the pen (I had that text popup while moving over the ‘System default’).

I will try to setup this this monday,as it’s friday and you know the friday rule 😉

Thanks, I’ll update you next week.


Quick update : 

I  added a ROLE tag = PROXY to each of my VSA Proxies, 

Then tried to change my Server Groups, to automatically target any server that has this ROLE = PROXY tag.

But, that’s not what I expected.

I can only select a TAG, not the real value of THIS selected tag : 

So, whatever value is set to that ROLE tag, it’s included in my selection.

So, this way I get what I expected, as I just created that ROLE tag. But if I added a ROLE = MA, then all the MA would be populating also that group.. 

I don’t understand how this works, or else, I don’t find this that useful to be able to provide values for tags if we can’t use them for filtering this way.

Or maybe I missed /misunderstood something?


Tagging @MFasulo here because this is exactly what I have been expecting of plans as well every since the concept was introduced. Nice thing I thought would be possible to have a more spread load of backups job running throughout the day as this would drastically reduce impact on infrastructures of a lot of customers. In addition it also spreads the load on CommServe level which helps on maintain a predictable performance on the CommCell itself.

We also still see a huge amount of jobs being started at the same time even though we use the plan logic to run a job every 12 hours. The blackout window should imho only be necessary in the case of a few exceptions. So using the blackout window to introduce some form of staggering is imho be a last resort.

Other thing to note here as well is when you for example agree upon a RPO with a customer that you really have to take this default behavior into account. For example in case of VSA you will have a backlog of clients to be processed which sometimes can take hours. The last clients to be processed will in that case miss their SLA. We taking this into account in the actual setup of the plan.


Onno, thanks for the tag in!  I will be posting a long explanation of this so standby for the reply.


Lets look at this from a couple facets:


Use the least amount of plans possible:


When we look at the plans, I always recommend that you create the least amount possible to better manage the environment.   Options like region based plans make this a bit easier for situations that allow this to occur.   In reality many cells have tons of plans, and this describes the 9 PM “clobber” .   Additionally, our priority engine that dispatches the work takes into consideration strike count, runtime and other details to tune the environment for optimal SLA adherence.  For environments that haven’t already built a ton of plans, resist the urge too (where possible), use things like extended retention or other copies to help manage plan sprawl.   For environments that already have a ton, can they be consolidated, do you really need all the plans.   If the answer is no, mass reassociation can be done from the “association” tab on the plan to go from one to another.  


Let the priority engine do its thing where possible:


As mentioned above, the system is designed to take several facets into account, so there is no need for explicitly manual tuning of job priority and other bits, like many of us old school admins are used to with Java.  Based on the SLA, the system will continually calculate how to get the jobs done to adhere to those set SLAs.   To keep the engine running smoothly inspect individual “protect” pages, look for “May miss SLA” and remediate as needed.   For machines that don’t need to adhere to strict SLAs, set the appropriate (on plan, like gold, silver, bronze) or globally via the commcell SLA setting.  


Leverage other options for fine tuning for timings :


I hear from folks (internal/external) all the time there Command Center doesn’t have option X or Y.   In those conversations, I always ask a slew of questions on the use case and other reasons and offer up alternative solutions where possible.     I want to take the time to outline some of those options (based on 11.28)


  1. Backup Window-  use these when you want to control when a plan will be running jobs. 
  2. Blackout Windows – use these when you need to absolutely prevent jobs from running.  Use “do not submit job” to prevent excessive errors and strain on job manager. 
  3. New in 11.28 is the “advanced” toggle on the plan RPO that allows you to control the timezone.   By default plans are set to respect the client timezone, but this can now be override (to all common timezone, in addition to CommServe timezone and Client timezone.
  4. Weekly schedules with set days (common for DBs to run weekly on a given day)
  5. Job start time overrides (VM Group level, Client level, Server Group Level)  allows you to control the start time of the respective entity.    For staggering I think folks are looking for a combination of the above and this option.  

As you can see there is various ways to help better control runtimes with good precision and where necessary. 


Exposing peaks and valleys and remediate if needed:


Veteran experts like Onno are aware of how to debug overtaxed environment, and I’m sure he can offer up techniques in this facet, but what if you are just the CV admin you may not have access to all the underlying details to remediate.  Here are some ways to expose what happening in the environment (for both the CV admin and even folks that have access to underlying infra)

  1. Use the new infrastructure load report.   This provide you with all the peaks and valleys of the infrastructure to see where you might have some dips to adjust some of the jobs.  
  2. Gain access to the hypervisor or cloud details.  
    1. In VMware using the monitoring tab can help gain critical insight into the health of the machines.  Alarms and alerts provide proactive alerting of such conditions.
    2. Leverage Commvault alerts and events to determine utilization or service degradation. 
    3. Most cloud vendors provide tools like AWS “Compute optimizer” that assesses the machines and tells you if they are right size
  3. The elasticity of cloud allows you to upsize or downsize instances within their respective instance type.  Take advantage of that
  4. Leverage Commvault autoscaling framework to assist in getting those critical workloads protected while gaining the cost benefit of having no long running instances. 


So we covered plan details, options to fine tune, and ways to understand the impact of the of whats happening and some remediation tactics.  If you look at most of these options, they are happening on a policy or group level so knowledge and management of this is easier.    Even in small environment I tend to not recommend tweaking the ‘lowest level” (think subclient)  as it becomes really hard to management, and scale makes it worse.   Now obviously I’m painting with broad strokes, but use this as a foundation (this is not an exhaustive list of things to do), to help ease some of the load burden on the system.   Coincidently, the less “stuff” in the commcell also plays directly into performance and responsiveness.  


Lets start with this… happy to continue the dialog, hit me with questions. 


Thank you Mike.  This was very helpful.


Dwayne


@MFasulo thanks for your extensive explanation! one cool thing that might be an idea to investigate is some form of IO monitoring. with an agent online you could gather some IO related metrics and use this information to determine the impact of a backup on the IO performance which directly relates to the question how is my application behaving and how is it being impacted by backup. generally speaking you could argue this is not really that of an angle that we want to cover but it could allow more dynamic configuration of readers which could result in auto-tuning backup configurations. 


@MFasulo thanks for your extensive explanation! one cool thing that might be an idea to investigate is some form of IO monitoring. with an agent online you could gather some IO related metrics and use this information to determine the impact of a backup on the IO performance which directly relates to the question how is my application behaving and how is it being impacted by backup. generally speaking you could argue this is not really that of an angle that we want to cover but it could allow more dynamic configuration of readers which could result in auto-tuning backup configurations. 

We used to do individual server perf stats… Cunningham (DC) is chasing where it went.  In my discussion with him, he identified that when he was exploring some of this to be integrated into security IQ/alerting subsystem, non-CV resource buffering (especially on up-ramp) need some healthy balancing logic, if we want to introduce some client based auto-tuning.    


I like where this is going!


To spin further on the individual server perf stat, this could also be very useful to present as where congestion is happening due to constrained resources. Client, network or server. Maybe this could be presented as statistics when you look at the job. To ease troubleshooting for bottlenecks. I know that veeam have had some of these statistics  for some time. They may not be completly accurate, but would be nice hints to where stuff happens.

Back to plans, I really like the idea of system scheduling and staggering jobs based on frequency, but as an MSP I would also like to see a some staggering across plans, and this could maybe be achieved by looking at performance resources for the central components as Mediaagents and Commserve to dynamically adjust how many jobs can start at the same time, adding more as long as there are capacity available.

Cause most customers would like backups to start at a certain point, in the evening and be finished by same time in the morning, giving us a hit on CS performance when the massive amount of jobs start if we do not stagger them. It might only need to stagger a few minutes to even out the loads. at scale, this is also a little hard to keep track of.


To spin further on the individual server perf stat, this could also be very useful to present as where congestion is happening due to constrained resources. Client, network or server. Maybe this could be presented as statistics when you look at the job. To ease troubleshooting for bottlenecks. I know that veeam have had some of these statistics  for some time. They may not be completly accurate, but would be nice hints to where stuff happens.


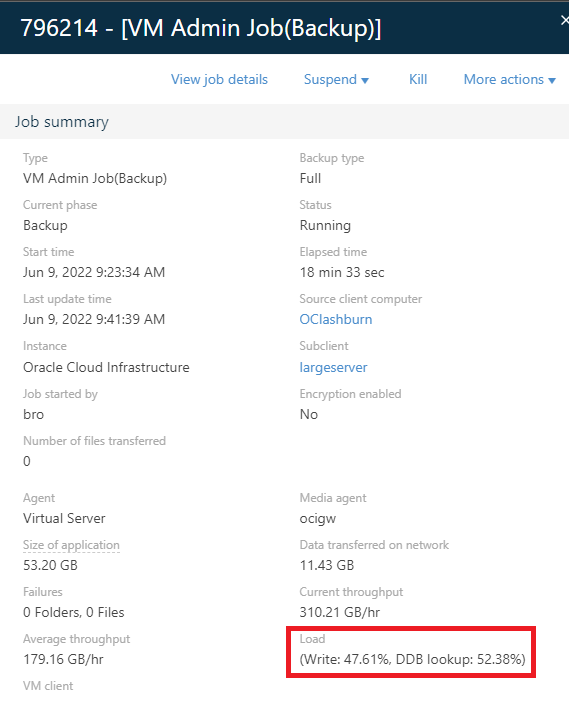
John, we have a similar feature.  In Command Center, you can see a entity for “Load” which tells you the distribution of each relevant component (you may see up to 4 entities, read, write, network, ddb)

The highest percentage “load” is the slowest component, so if i was looking to improve performance, I would target DDB.  


Back to plans, I really like the idea of system scheduling and staggering jobs based on frequency, but as an MSP I would also like to see a some staggering across plans, and this could maybe be achieved by looking at performance resources for the central components as Mediaagents and Commserve to dynamically adjust how many jobs can start at the same time, adding more as long as there are capacity available.


Got it, ill focus on the CS side of thing.   MA side we could use KPI based statement management 


Cause most customers would like backups to start at a certain point, in the evening and be finished by same time in the morning, giving us a hit on CS performance when the massive amount of jobs start if we do not stagger them. It might only need to stagger a few minutes to even out the loads. at scale, this is also a little hard to keep track of.


Understood, we have the CS stats to properly balance this, just need to put them in play at a higher level.   


Bump @MFasulo,


I am, and I think with me a lot of others, interesting in an update regarding this thread.


Thanks!


Reply