


You might have heard that CommCell views are an easy way to start building your own custom reports. While you can use any table from the CommServe database to create a data set for a new report, the data that you see in those tables doesn’t always make sense to a human. CommCell views are saved queries of the CommServe database, and they are available in every CommServe installation by default. These views display human-readable information from the database so you can find information that’s relevant to the report you’re trying to create.
Preview Data in SQL Server Management Studio
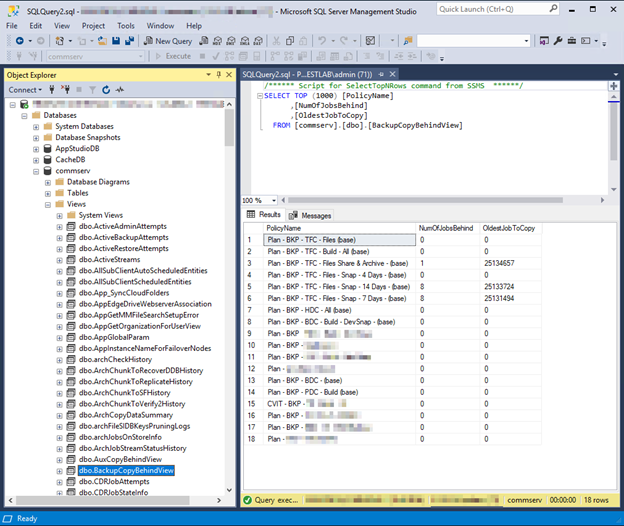
You can run CommCell views and see the results using SQL Server Management Studio, which is installed along with the CommServe software on the CommServe computer. There are many CommCell views, so if you just want to look at everything that’s available, SQL Server Management Studio is a good place to start.
- Log on to your CommServe computer.
- Click Start > Programs > Microsoft_SQL_Server_version > SQL Server Management Studio.
- Go to the following location by expanding the tree in the left pane: CommServe computer name\database_instance_name > Databases > CommServ > Views. The available CommCell Views are listed in the left pane. For a cluster, instead of the database instance, a default or Named instance is displayed.
- To open a CommCell view, right-click the view, and then click Select Top 1000 Rows.
These steps are also available on the Commvault Documentation website at Accessing CommCell Views.
Preview Data in the Report Builder
Perhaps an easier way (and my preferred method) to see what’s in a CommCell view is the Preview feature in the Report Builder. You can select views for the basis of your data set and see some data before you start building.
- Open the Report Builder.
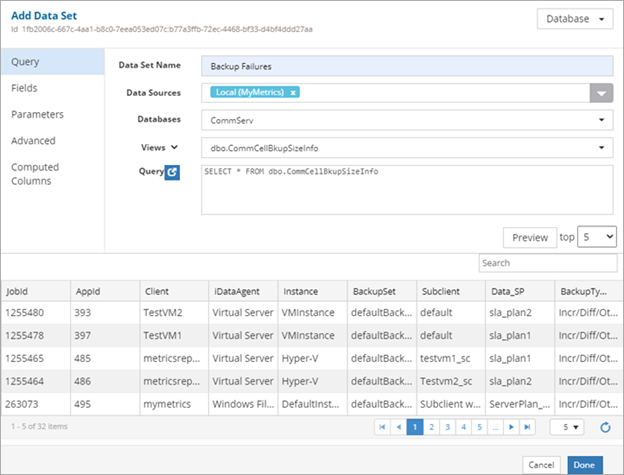
- On the Dataset tab, click Add. The Add Data Set dialog box appears.
- From the list at the top-right of the dialog box, select Database.
- In the Data Set Name box, enter a title.
- From the Databases list, select CommServ.
- From the Tables list, select Views.
- From the Views list, select a CommCell View.
- In the middle of the dialog box, click Preview. A preview of the data available in the View appears.
If you don’t see the data that you want to use in your report, just select another CommCell view from the list, and then click Preview again.
Build a Report from a CommCell View
The following steps can help you build an example of a custom report based on a CommCell View. These steps are also available on the Commvault Documentation website at Example: Building the Backup Failures Report.
Create a New Report
On the Web Console, click Reports. The Reports page appears.
- From the navigation pane, click Configuration > Reports, and then click New Report. The Report Builder page appears.
- On the Reports tab, in the Report Name box, type Backup Failures, and in the Description box, type “Includes information about the backup jobs that failed in each CommCell environment.”
Configure the Dataset
On the Dataset tab, click Add, and then configure the settings:
- In the Add Data Set dialog box, on the Query tab, select Database.
- In the Data Set Name box, type BackupInfo.
- In the Data Sources list, select Local (CommCell Name) , and in the Databases list, select CommServ.
- Select Views, and in the list, select dbo.CommCellClientLevelBkpJobSummary.
- Click Preview to collect the field names that you can use as columns in your report.
- Click the Advanced tab, and in the Time Out box, type 10.
- Click Done.
Create a Data Table
From the Visualization tab, drag Data Table to the Drop components to build the report box.
- From the Data Set list, drag these field names to the Data Table: Data Source, ClientName, TotalJobs, Failed, FailedObjects, FailedFolders.
- Select the table, and on the Properties tab, click General.
- In the Title box, type Job Failure Summary.
- On the Properties tab, click Fields, and then configure sorting and column names:
- Beside Sorting, click Add Sorting, select Failed Jobs from the list, and then select Desc. The data in the table is sorted by the number of Failed Jobs in descending order.
- Expand each Field Name section, and in the Display Name box, type a new name for each column: CommCell, Client, Total Jobs, Failed Jobs, Failed Objects.
Create a Bar Chart
From the Visualization tab, drag Vertical Bar Chart to the Drop components to build the report box.
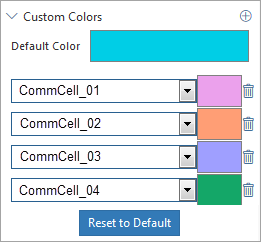
- On the Properties tab, click Fields and configure custom colors for the bars.
- Beside Custom Colors, click Customize Series Colors.
- Select each X-Axis from the list, and then click the box next to it.
- Click the Default Color box, select a color from the Color dialog box, and then click OK. Any bar that is not configured with a custom color displays the color configured in the Default Color box.
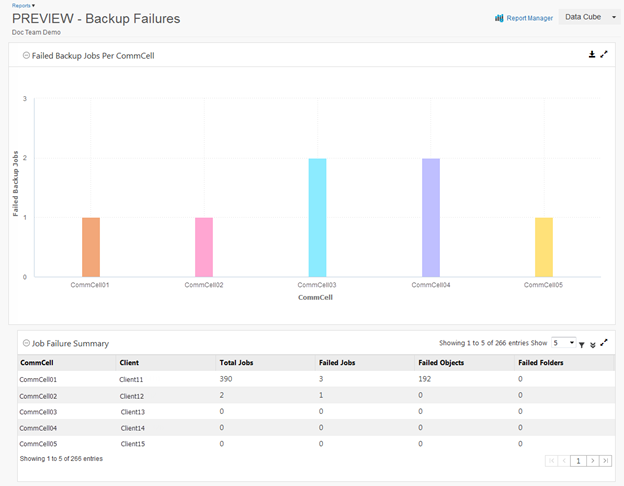
Preview the Custom Report
- To see what the report will look like, click Preview.
- At the top of the page, click Save, and then click Deploy. The report appears on the Worldwide Reports page under Untagged.
For additional information about creating custom reports, see the Commvault Documentation at Build Your Own Reports.