Question

DDB Q&I performance critical - 5,000 - 9,000 ms

  • 18 September 2023
  • 12 replies
  • 463 views

Userlevel 2
Badge +13

Hello Commvault,

I try to find a workaround in order to reduce a DDB Q&I times.

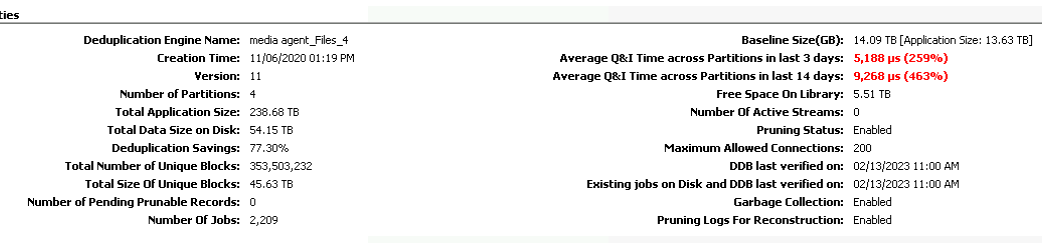
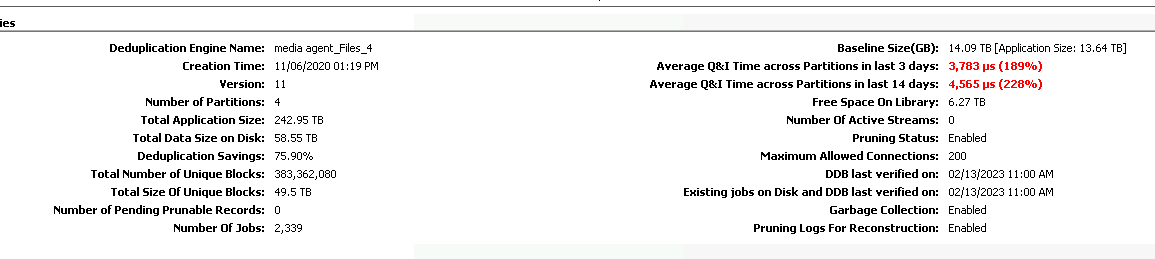
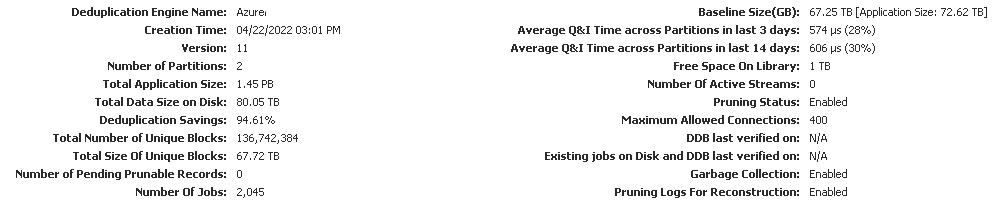
The DDB is currently 238 TB, based in Shared partitions (Azure Blob Storage).

Average Q&I times was 9,000ms (in Premium SSD (P15) in Azure VM, single Drive.


After split “DDB paths” (to separate Disks) and add another 2 X SSD (for DDB partitions), currently average Q&I times was reduced to 5,200ms.


Is there any way to succeed better performance?

Maybe to Seal the DDB ?


12 replies

Userlevel 7
Badge +19

I can't believe the DDB itself is 238TB in size, so I expect this to be the footprint of written data towards Azure Blob Storage that is related to the DDB. Is it a single MA with one DDB? Which version are you running?

The problem in Azure was always that there wasn't a decent low latency storage offering available and you have to create a stripe set spanning multiple disks to get more IOps, but still latency sucked and was not very consistent. Nowadays you can pick Premium SSD v2 or go for Ultra Disk, but before moving towards a different storage offering please make sure your DDB is optimized to have the latest enhancement enabled such as garbage collection and that it doesn't contain a lot of white space as this also impacts performance. The documentation contains a lot of information, but you can always consider opening a ticket and have someone from support to perform a quick assessments. 
 

Userlevel 2
Badge +13

I can't believe the DDB itself is 238TB in size, so I expect this to be the footprint of written data towards Azure Blob Storage that is related to the DDB. Is it a single MA with one DDB? Which version are you running?
 

Hi @Onno van den Berg 

Your right, 236 TB is the Application Size.

DDB size is ~95 GB in a single MA (VM Server in Azure).
Before some days I split the DDB partitions from a single Drive  -→  4 X separate Premium SSD (P15) Drives.
(That’s why last 3 days performance is better).

Here is a screenshot:

Probably, I will go for a new ticket, but Im afraid the answer will be again just upgrade your SSD tier...

That’s why I write it in Commvault Community!

Thank you in advance!

Badge

Hi!

Do you have any updates?

Thank you,

Andrei

Userlevel 2
Badge +13

Hello @Andrei Constantin 

Yes, I have an update!

Initial DDB location was in 2 X SSD Drives with these high Q&I Times.

But after added 2 more SSD Drives in MediaAgent (without changing the Premium SSD tier in Azure side), the Q&I Times went down after some days.
Now, total DDB Drives in MA are 4 X Premium SSD (P15 Azure Disk tier).

Check current status after changes:

Best regards,
Nikos


Userlevel 6
Badge +15

Hello !

Well, I find that strange, as I have a somehow identical perimeter managed by one of my MAs in Azure, and I get normal values, check mine : 


Are you sure that the disk/volume used to host the DDB is _dedicated_ to the DDB only ?

Is its path also excluded from realtime antivirus/antimalware scan analysis?

What is the AzureVM instance type that you are using ?

My MA is running on RHEL8.8.

Regards,

Laurent.

Userlevel 2
Badge +13

Hey @Laurent 

Thanks a lot for your reply!

Yes, the SSD Drives are dedicated to DDB, and excluded from A/V.

I have similar / high Q&I Times also to another client, using again Windows Server MA with VM Azure size: Standard D8s v3 (8 vcpus, 32 GiB memory).

In the past, I had opened cases to Commvault, (230214-557) but we always ended up that the issue seems to be the huge o365 workloads and small MA size...
Around 5,000 o365 users with Exchange online, OneDrive, SharePoint online and Teams backup with daily scheduled backups for over 3 years (with infinity retention).

So, I hope at least these Q&I Times not to be issue at this time.

Please for your feedback,
Nikos

Badge

Thank you for your answer Nikos!

Have a nice day,

Andrei

Userlevel 6
Badge +15

Azure VM size on my side is StandardD16s v4, and we have added premium SSD LRS disk of 2TB just to host the DDB. Host caching R/W.

Max IOPS is 7500 as per Azure disks.

If you are running windows, then you should check the resource monitor and check the disk queue, to see what’s going on on this volume.

Sealing the DDB will result in generation of new blocks and temporarily growth of back-end storage, but it is also a good way to ensure your DDB is not filled with holes.

Keep in mind that when using deduplication, each stream performs a signature check in the DDB and this is reading the _whole_ DDB at each pass. This means that if you have like 100 streams in parallel, the whole DDB is beeing fully read for 100 times. Multiply this by the  size of your DDB and you may have clues of why it’s reporting slow response times, depending on your activity, disk setting, performance tuning and DDB content age.


Regards,


Laurent. 

Badge

Hello Laurent,

Thank you for all the details.

Yes it make sens.

We found that the problem is not the IOPS but the response time (MA on the Azure cloud dedicated disk for the DDB).

Best regards,

Andrei


Userlevel 6
Badge +15

 Provides excellent paths to follow/check.

Userlevel 2
Badge +13

Hello Laurent,

Thank you for all the details.

Yes it make sens.

We found that the problem is not the IOPS but the response time (MA on the Azure cloud dedicated disk for the DDB).

Best regards,

Andrei


Hey @Andrei Constantin 

So, what was your changes in Azure side, in order to low Q&I Times?
 

Best regards,
Nikos

Badge

Disable sparse file attribute, that will slightly lower the dedup ratio but it will significantly speed up your ddb

Reply