Understanding DDB Statistics

  • 21 April 2022
  • 6 replies
  • 1077 views

Userlevel 1
Badge +5

Hello there.


In the last couple of months I was asked by a few customers where all the data growth on their disk libraries came from. And by digging deeper into that topic I tried to understand the data and statistics from the DDBs. I had to realize that some of those statistics seem to be very odd and that I don’t understand them. So maybe someone can enlighten me.


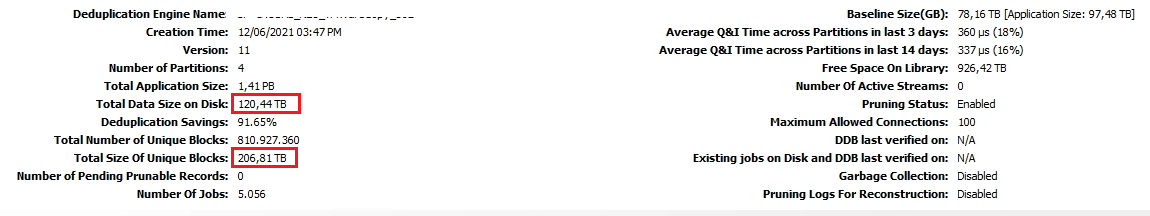
Let’s take a look at a screenshot from statistics of a “normal” DDB:


So what do we got here:

Deduplication Engine Name: self-explanatory

Creation Time: self-explanatory

Version: I just take this as it is but is there anything out there but Version 11? Does it refer to Commvault 11? I thought a recent DDB should be Version 5 (or 4.2 if you prefer) and a somewhat older DDB should be version 4. So what does “11” mean”?

Total Application Size: AFAIK this is the total data that got backed up into this DDB. All fulls, incrementals and so on before compression and dedupe.

Total Data Size on Disk: Seems to be self-explanatory
Deduplication Savings: Simple Math: 1 - (Total Data Size on Disk / Total Application Size)
Total Number of Unique Blocks: Simply the number of the unique blocks. At first I thought that you should be able to multiply this with the block size (typically 128 oder 512 KB) and get the Total Data Size on Disk. But I already learned that data normally get's compressed after signature generation and so it is smaller than your block size. You can read about that here: https://community.commvault.com/commvault-q-a-2/the-difference-in-the-number-of-unique-blocks-in-deduplication-databases-1510
Total Size Of Unique Blocks: Is this before or after compression?
Number of Pending Prunable Records: The records that data aging identified for aging and that still need to be pruned.
Number Of Jobs: self-explanatory
Baseline Size(GB): AFAIK the baseline is the size of one full backup of everything (before compression and dedupe).
What about the Application Size in this row? I would guess this is the size of all fulls + incrementals of the last(?) backup cycle. Correct?
The rest of the statistics is IMO self-explanatory


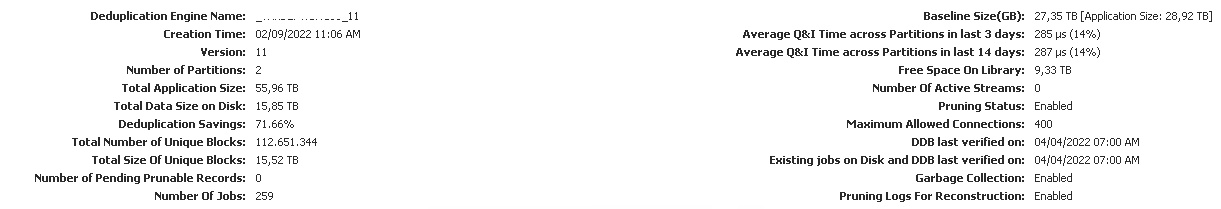
Now let’s look at some statistics that seem to be weird:

In my oppinion we have 2 things that occupy space on the disk library: The unique blocks and some meta data. So the Total Data Size on Disk should be a bit higher than the Total Size Of Unique Blocks, right?

But what happend to the DDB on the former screenshot? Why is the Size on Disk so much higher?


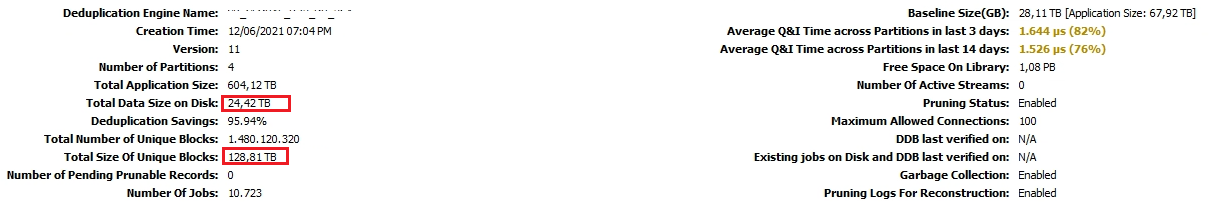
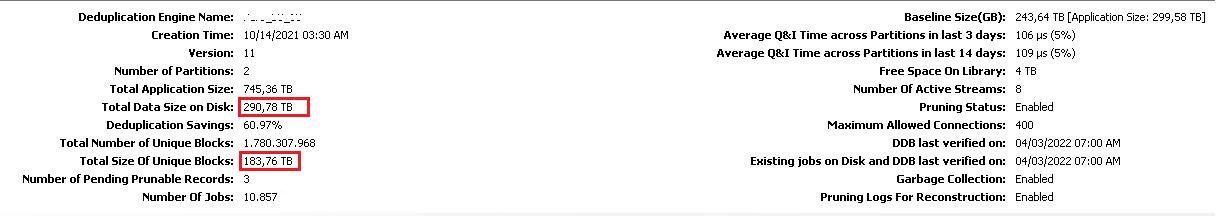
This one is even worse. Why on earth is the Total Data Size on Disk much lower than the Total Size of Unique Blocks? Is this even possible?


That’s it for now. Hopefully somebody can give some insights into this.


Regards

Pasqual


If you have a question or comment, please create a topic

6 replies

Userlevel 7
Badge +23

Hi @Pasqual Döhring , your understandings are pretty spot on.

What you have here is more data on disk than what is backed up (application size is the scanned size on the client).

What I noticed is that your Query and Insert times are REALLY bad.  It’s possible the pruning is just held back (though it does show 0 prunable records).

Can you take a look at the sidbprune.log and sidbphysicaldelete.log files for the pruning Media Agent?

Userlevel 1
Badge +5

Hi @Mike Struening .


You are right that the Q&I times are bad in this case. I took a quick look into the mentioned log files but did not see anything obvious. On the other hand this is a huge environment and already 15 SIDBPrune*.log files have been generated in the last 5 hours. So I might miss something here.

But still: If the pruning process would not work then we should see pending prunable records. And additionally I would expect the size on disk to be much bigger than the size of the unique blocks.

I even found a similar example with for this case with much better Q&I times on another DDB:


So the question still remains: What is happening here? Why do we see a total size on disk which is lower than the total size of unique blocks. And the other way round: Why is the size on disk sometimes much higher than I would expect?

Userlevel 7
Badge +23

My suspicion is that the DDB has gone through the list of prunable blocks, handed them off to the pruning Media Agent, which has yet to physically delete them.

Of course, that’s just based on what I can see here.

Were you able to take a look at the sidbprune.log and sidbphysicaldelete.log files for the pruning Media Agent?

If there’s nothing obvious, a support case to do a deep dive is likely best.

Userlevel 1
Badge +5

As I already wrote “ I took a quick look into the mentioned log files but did not see anything obvious. On the other hand this is a huge environment and already 15 SIDBPrune*.log files have been generated in the last 5 hours. So I might miss something here.”

Okay, let’s forget about the case with the low data size on disk for the moment. What about my other questions? Why is the data size on disk sometime quite huge? What about the version number? Is “Total Size Of Unique Blocks” before or after compression?

Badge +2

Hello Pasqual !

Is there any chance that your environment is running on v11.20.90 ?

We have had a supportcase going for DDB statistics, and CV DEV has confirmed today that there is a fault in v11.20.90 which is not updating the DDB statistics.

The fault was very visible for one of our environments since there we had a new DDB generated after upgrading to  v11.20.90 where we have backed up several PiB, and Size on disk is still 0.

The fault is reportedly corrected in 11.20.91


Kjell Erik Furnes

Userlevel 1
Badge +5

Hi @Kjell Erik Furnes .


The screenshots are from 2 different commcells. One is on 11.24.x and the other is on 11.26.19.