Question

Understanding Job Details / Progress / Load Read statistics

  • 28 November 2023
  • 2 replies
  • 320 views

Badge

Hi,


Like my name state, I’m quite a beginner so please bear with me.

I’m writing this after finding a similar post answered more than a year ago that didn’t quite answer my own question.

https://community.commvault.com/self-hosted-q-a-2/average-throughput-information-read-write-network-ddb-lookup-meaning-2854


I have this job that backup a SMB File share running on my media agent. The file share contains RDS Profiles and HomeDirectory so it contains millions of relatively small files.

The job has been running for 3 days and it’s ETA is at least 7 days.

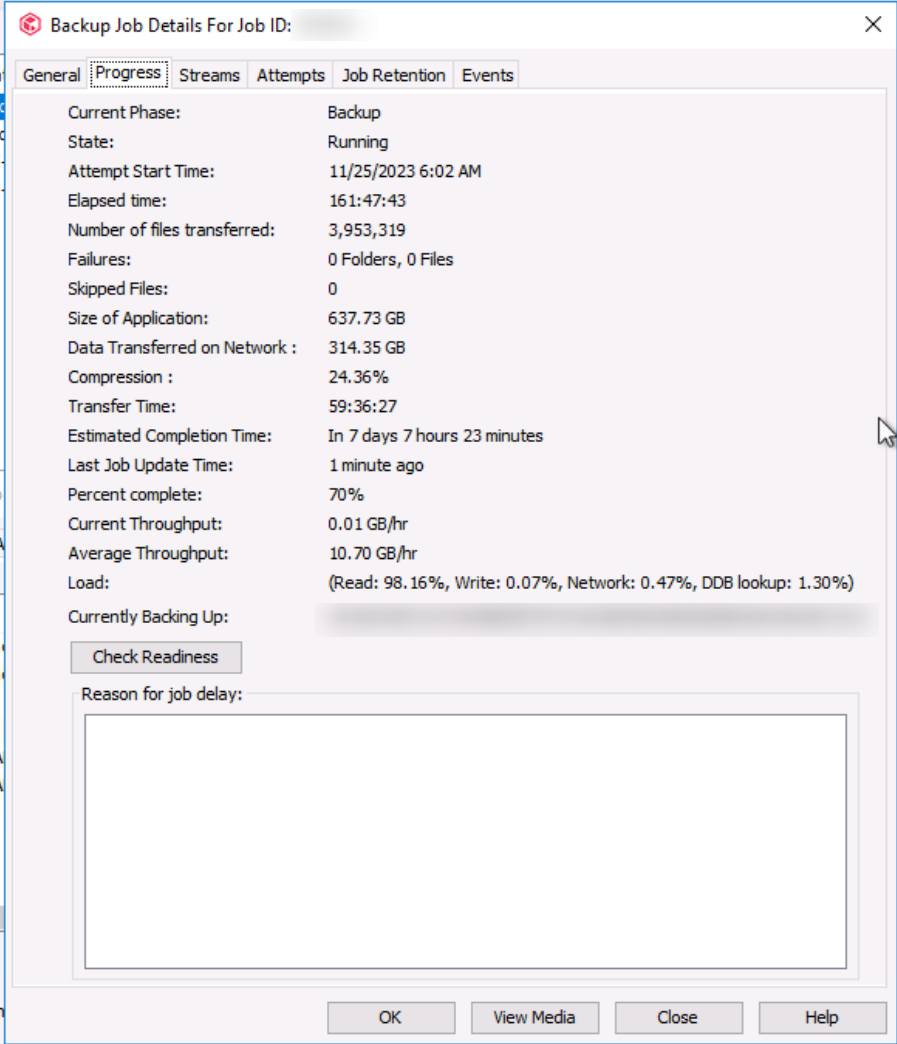
The Job details / Progress tab / Load portion says : Read 98% Write 0.07% Network 0.47% DDB Lookup 1.30% with a current throughput of 0.001 GB/hr. I have no idea where it got the Average Throughput from because I’ve never seen it over 1GB/hr).

The Subclient job setting / Advanced settings / Performance tab / Number of Data Readers is fixed to 10 data readers.


My questions are :

  • Read being that high and others start so low, does that means the bottleneck the Read part taking too much time ?
  • Does that mean I do not have enough Data Readers and augmenting the readers will speed up things or does it mean CV is already overloaded on the reading part and increasing Readers will make things worst ?
  • If increasing the number of Data Readers is the solution to speed things up:
    • Should I set it to Automatically use optimal number of data readers ?
    • If it’s best to keep it at a fixed number, What increment would you suggest I should use next ? Skip to 100 readers and see how it goes from there ?


Thank you for all that will take time to answer my questions.

Have a good day.


2 replies

Userlevel 7
Badge +23

Hey @TheCVNoob,

You are right that the 98% read indicates that read is the bottleneck. The problem with backing up millions of files (especially over SMB) is the opening/closing of each file which adds tremendous overhead to a backup operation. The source storage is easy overwhelmed since its managing the locks/unlocks of file resources

What device are files on? would it be possible to protect it at the source rather than via the SMB share?

Changing the number of reads could help or hinder as you say. Since the current throughput has dropped to so little - it almost seems like the transfer has stopped and the source storage may be overwhelmed. In your case it may be beneficial to lower the amount of readers as a guess - but this is not an exact science, and you may need to experiment to find the optimal setting. I can say that 100 would be bad...


In either case, if its possible to protect the data from the source rather than via an smb export that would be ideal - especially when using block level backups which bypass the file open/close overhead altogether.

Userlevel 5
Badge +9

Hi @TheCVNoob 


Thanks for your modesty, but great work getting here! 

I’ll start at the top;
- The throughput is calculated using Application Size and Run Time (600GB over 60hrs). 

- Read is where 98% of the time is being spent. So its currently the bottleneck.

- You can increase the number of readers at the subclient level, the application layer will not become overloaded, but the limit will be defined by the next Bottleneck (Hardware (CPU,Memory), network write, disk write, deduplication performance etc).


There is no rule here on whats best, but fine tuning is often required. You could start by increasing the number of readers by 10 if the hardware isnt breaking a sweat yet. Or you could go more conservatively at increments of 5.

The automatic option, appears to be predefined based on IDA and may not ‘scale’ up based on your hardware availability:
https://documentation.commvault.com/2023e/expert/10979_setting_data_readers_for_file_system_agents.html

You’ll need to let the job run for a good period of time to asses improvements (perhaps 1hour).

If you want to review the logs to see actual read throughput;

CVPerfMgr.log on the media agent will update periodically a summary of all performance counters.

CLBackup.log (Windows client) or clbackupchild.log (Linux client) will provide the read speed live.


Cheers,
Jase

Reply